
ErgWare
Open source software for an open source ergometer
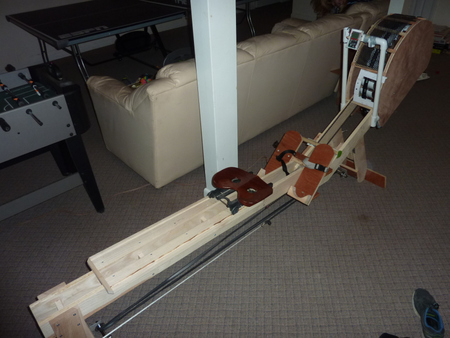 Our DIY ergometer with its new “brain”
Project overview
Hey all, Dave Vernooy here with another project. I’m assuming you stumbled across this site after reading about DIY rowing machines, aka ergometers.
This will document all aspects of ErgWare software development, a project I undertook to add a digital interface to the excellent openergo project. You can see the erg we built above using the original project documentation as a guide. It was a present for my daughter, which my dad & I pulled off in a month. He focused on the woodcraft, and I chipped in with the mechanical stuff, the electronics and the software.
It was great fun to build, and is even more fun to use. Here’s a video of it in action
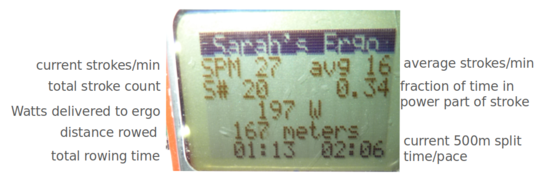
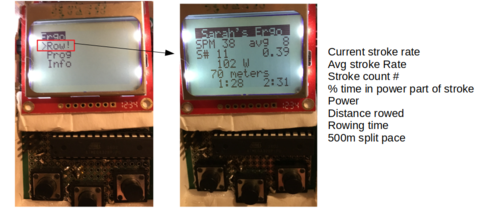
After noodling on the original design, we decided it would be neat to add the software & display so the rower could get real-time feedback on the basic things a rower would want to know. We were able to get good estimates of stroke rate, power output, effective 500m split pace, distance rowed and fraction of time spent in power phase of stroke. Here is a close-in screenshot of the current version (you can see this display in the main picture above attached to the pvc tubing).
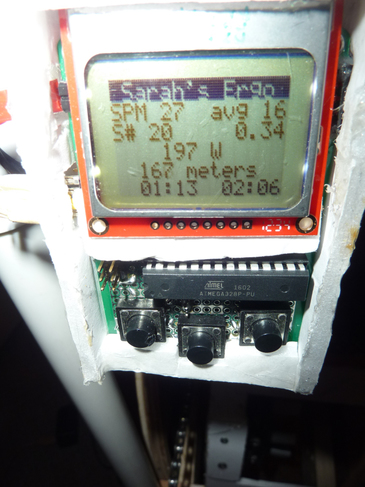 Screenshot of the software interface
The whole idea worked out pretty well, so I thought it would be good to add it back to the community as an open project. The source code and all documentation is here and available for free to download, use & modify. The documentation package includes 3 things:
- A pdf document with circuit diagram, some rudimentary construction notes and links to useful web sources I used in the project.
- An excel spreadsheet with a numerical model I built just so I could make sense of what is going on in an erg. [I am not a rower, but made some good progress with this approach. It was cool to see data from the erg match the model really closely … so I think the numbers all make reasonable sense].
- All of the source code, designed for the Atmega328 microcontroller (Atmel AVR series).
The main purpose of this website is to give some more detailed explanations & answer questions about the software for those who have them …& update on any new progress we may (or may not) make.
I’ll take you through the build & verification process, but for me it was first important to understand the basic workings of an ergometer. I have never actually done any rowing, so I needed some intuition to guide me. For that, I found a really great physical model. I built up my own numerical version of this which is posted in the excel spreadsheet, but more on that soon.
S.T.E.M.
Rowing is about energy conversion - from the rower into either the movement of the boat on the water, or the flywheel on the erg. For the erg, all you really need to do is accurately measure the instantaneous rotation rate of the flywheel and keep track of it. Intuitively obvious? If so, skip the model. Otherwise, here’s some background
Model
Before diving into the software, here is more about the numerical model and how you can infer power, distance rowed and a bunch of other interesting things. I found this really important to understand before I sat down to do the software.
Math
Just a couple of equations to get you warmed up. From Physics 101, the torque \(\tau\) the rower applies to the flywheel via the chain mechanism is related to rotational acceleration \(\dot{\omega}\) by the moment of inertia \(J\)
\[\begin{align*} J\dot{\omega} = \tau \end{align*}\]However, the flywheel slows down because of those plastic things I put on there. Most things that move through air experience a loss proportional to the square of their speed, so a better equation is
\[\begin{align*} J\dot{\omega} = \tau - k\omega^2 \tag{1} \label{power_stroke} \end{align*}\]where \(k\) is a damping constant. This is really just Newton’s law applied to a rotating object (the flywheel) - and the equation comes from the free body diagram of that object.
Once the oar (or chain for an erg) reaches the end of the stroke, the rower stops applying the torque and the chain returns (aided by something stretchy). During this phase of the stroke, the rower rests and the flywheel slows down, because its new equation is
\[\begin{align*} J\dot{\omega} = - k\omega^2 \tag{2} \label{recovery_stroke} \end{align*}\]So here’s something interesting: in this equation, we know \(J\) (see below), and we’ll know \(\omega\) and \(\dot{\omega}\) from the flywheel rotation, so we can calculate \(k\) if we can isolate this phase of the stroke (more on that soon).
Since instantaneous power \(P(t)\) is equal to \(\tau\omega\), we get
\[\begin{align*} P(t) = J\dot{\omega}\omega + k\omega^3 \end{align*}\]or, time averaging over one stroke time \(T\) you get the time-averaged Power \(\overline{P}\). Now we can start to keep track of something everyone wants to know about: how much raw power you’re putting out.
\[\begin{align*} \overline{P} =\frac{1}{T}\int_{0}^{T} (J\dot{\omega}\omega + k\omega^3)dt \tag{3} \label{power} \end{align*}\]Two interesting ways to further simplify Equation \(\ref{power}\)
Remember, there’s no torque during the recovery part of the stroke
So defining \(T_p\) as the time for the power part of the stroke and \(T_{rec}\) as the recovery part, so that \(T_p + T_{rec} = T\), then
\[\begin{align*} \overline{P} =\frac{1}{T}\int_{0}^{T_p} (J\dot{\omega}\omega + k\omega^3)dt \tag{4} \label{power2} \end{align*}\](This is the exact equation I implemented in the code).
The first term in the integral of Equation \(\ref{power}\) is close to zero because acceleration almost balances the deceleration over a complete stroke
So we if we define the average rotational speed of the flywheel over the total stroke time \(T\) as \(\overline{\omega}\) then
\[\begin{align*} \overline{P} = k{\overline{\omega}}^3 \end{align*}\]The first simplification above takes no shortcuts and is accurate within the limitations of the model. The second one is a nice simple equation, but has about 5% inaccuracy. It is a similar looking equation to the power generated by a wind turbine, for example, as a function of wind speed.
Getting the right model parameters
I cooked up a little spreadsheet to play with this model. It is posted with the code. Like any model, it needs a bunch of parameters. I’ll talk about them one by one, and how to go about measuring or setting them.
Simple stuff
Two parameters, the rower’s mass \(m\) & distance of erg chain \(r\) relative to flywheel axle can just be estimated or measured and entered.
Rower applied force
There is an assumption of a sinusoidal force applied by the rower. The amplitude and shape of that force are inputs.
Flywheel moment of inertia \(J\)
Its possible to calculate the moment of inertia \(J\) of the flywheel by accounting for all of the piece parts and their contribution. That’s what I did.
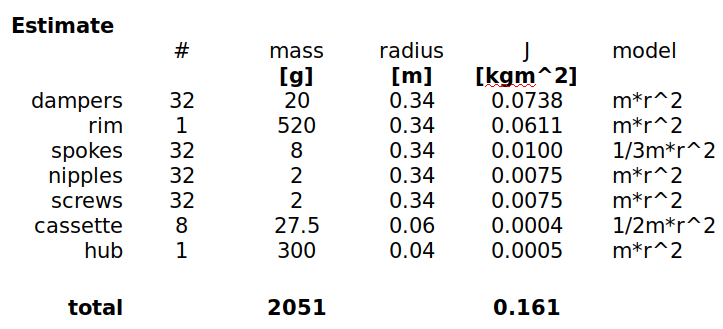 Estimate of flywheel moment of inertia \(J = 0.16\) \(kgm^2\)
Its just an estimate and sort of the lazy way out, but probably good within 10 or 15%. I’ll address it at some point with a measurement, just like this procedure outlines.
Damping constant \(k\) & “stroke detection”
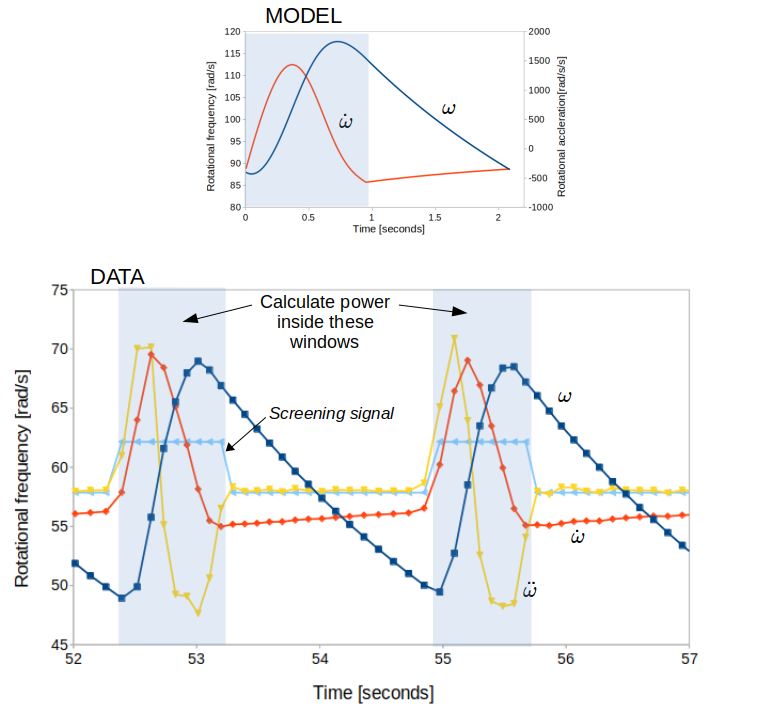
The main thing I discovered is that you can use the decay of the flywheel rotation during the “recovery” phase to measure the damping constant \(k\). (Remember, the recovery phase is when the rower is done pulling and the flywheel is just spinning under its own inertia as the rower returns to the initial catch position).
But how do you know when that is? Well, looking at the plots you can see that \(\omega\) decays almost linearly during the recovery. Here’s a picture of the rotational velocity \(\omega\) vs. time for 4 strokes. The linear decay is highlighted in yellow.
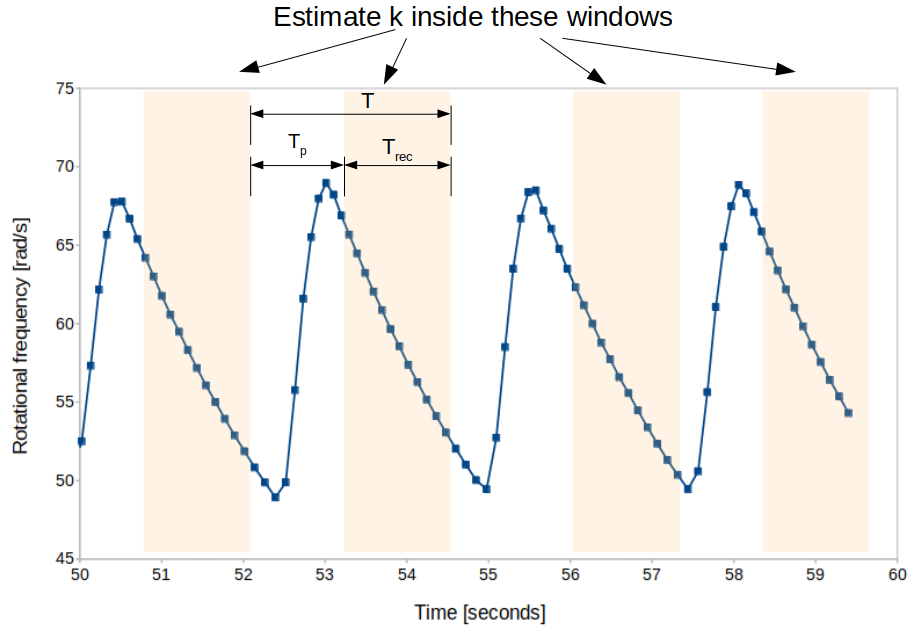 Highlighting rotational frequency vs. time during the recovery phase
We can use the fact that the second derivative of the curve in this region is basically zero to set a threshold to detect it, and then “mask” it off in the software. Another way to see it is by doing a little math. In this region, Equation \(\ref{recovery_stroke}\) is the important one:
\[\begin{align*} J\dot{\omega} = - k\omega^2 \end{align*}\]Setting the \(\omega = \omega_i\) at the start of the decay (recovery) period, you can solve this to get
\[\begin{align*} \frac{\omega}{\omega_i} = \frac{1}{1+{\epsilon}t} \end{align*}\]where \(\epsilon = \frac{k\omega_i}{J}\). For \(J = 0.16\) \(Nm^2\), \(k = 0.0003\) \(Nm^2/rad^2\) and \(\omega_i = 70\) \(rad/s\) - we find out \(\epsilon = 0.2\) \(s^{-1}\). This is small enough that we can simplify
\[\begin{align*} \frac{\omega}{\omega_i} = {1-{\epsilon}t + {\epsilon}^2t^2} \end{align*}\]whose second derivative \(\ddot{\omega} = 2{\omega_i}{\epsilon}^2\) is indeed very close to zero when \(\epsilon\) is small. So I set “screening criteria” on the absolute value of both of these parameters and use that to “detect” the stroke recovery phase. I can use this to count strokes, and I can use it to isolate the region in which I estimate \(k\). Clear enough?
Magic factor
The other thing a rower wants to know is how far they’ve rowed. (well it turns out, not very far in an erg unless you have some special power). However, assuming that there is a similar damping effect in the rower’s speed \(v\) on the water, the damping losses
\[\begin{align*} k{\overline{\omega}}^3 = cv^3 \end{align*}\]The magic factor here is \(c\). Most erg’s spit out a distance rowed, and you can see that we can transform total rotations of the flywheel to distance rowed with \(s = {(\frac{k}{c})}^{1/3}\theta\). I used a magic factor of \(c = 2.8\) just like here.
Converging the model
Having set all of these things in the model, there is one free parameter. I have chosen it to be the total stroke rate (which sets the overall stroke time). Once that is set, you need to “goal seek” the initial rotational frequency so that the initial and final match (as they would in steady state). This will give a converged model.
Finally, it predicts a certain shape for the time dependence of the rotational frequency. Here’s what it should look like -
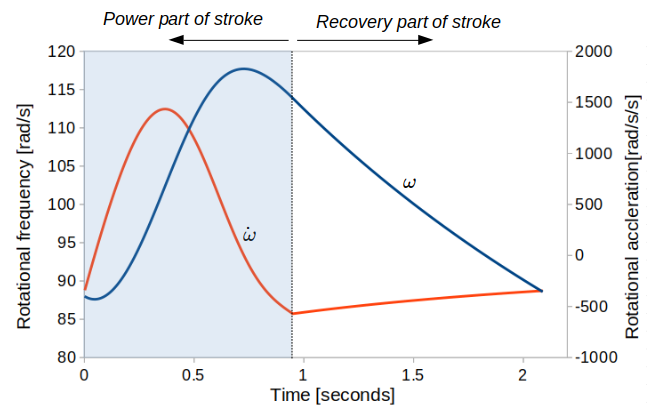 Model prediction of what the rotation rate looks like vs. time during the stroke
and another prediction from the model is the power output
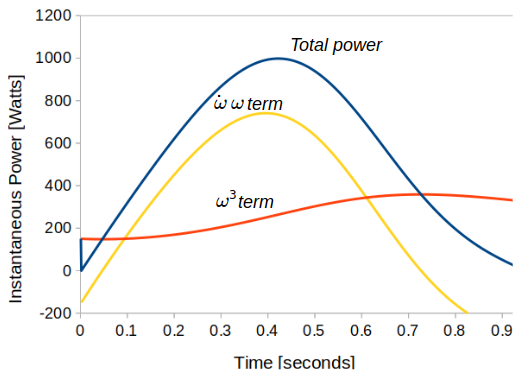 Model prediction of instantaneous power profiles, and the two components that make it up
Wonder if that’s what we’ll see when we get this sucker built? [foreshadowing].
Hardware
The erg
I’ll ignore the (awesome) build of the main wooden structure of the erg, though my favorite part of the whole thing is the seat .. thank you Joe Van Ruyven!!!. The flywheel is just an old 26” disc-brake mountain bike wheel drilled to accommodate the plastic inserts which act as dampers. The chain that the rower pulls on to move the flywheel sits on the 11 tooth cog.
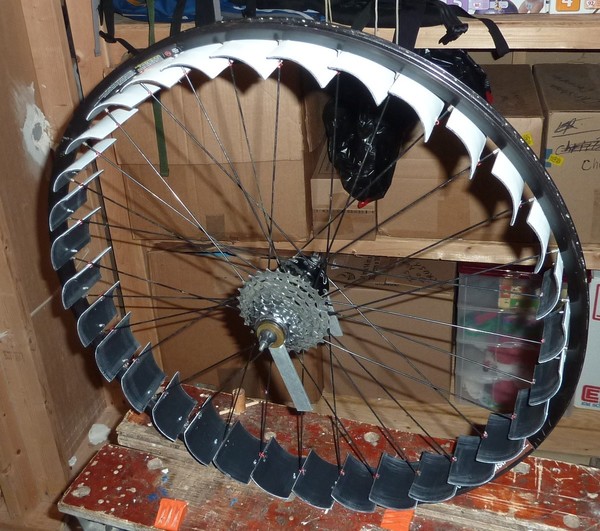 The modified mountain bike wheel is now ready for the water
Measuring rotation
Rotation rates of wheels can be measured a bunch of different ways. On my old-school Sigma bike computer they do it with an electromagnetic relay which opens every time a magnet attached to the wheel passes by. That works well, but I didn’t have a spare one lying around. What I did have was one of these:
 Optical switch used for reading the chopper wheel
An infrared optical transmitter-receiver pair. And a bunch of old CD’s. And a spare bolt hole pattern from the (removed) disk brake on the bike. And tape. And a way to open up the ID of the CD to fit over the hub (hint: use a soldering iron as a plastic-melter). And a few hours to kill. And so I made this chopper wheel:
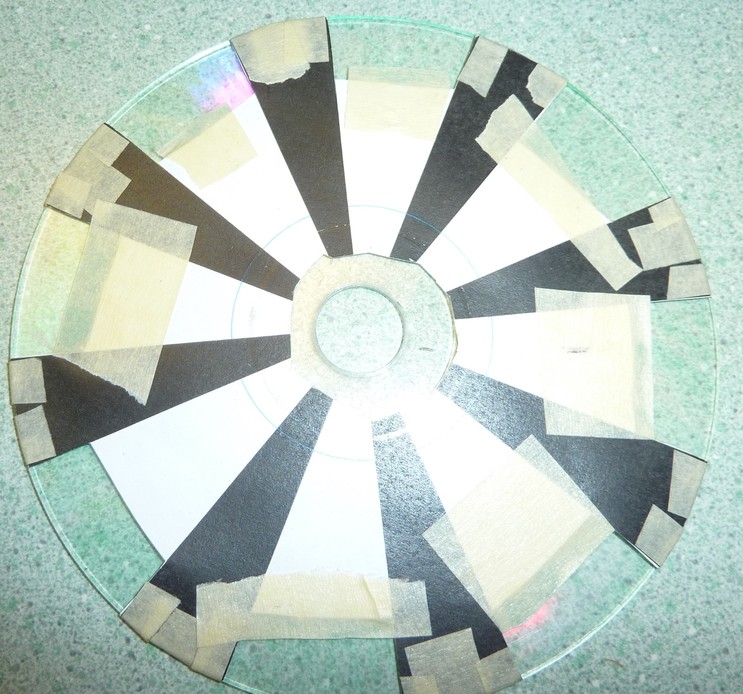 This CD has a new lease on life
The idea is the infrared light does not transmit through the black toner of the laser printer (of course I checked this diligently prior to killing those two hours … NOT!). So every time the black part of the chopper pattern goes between the optical switch, it interrupts the light, which is really easy to detect electronically. You can find the 8-wedge pattern I used in the documentation. Here is what it looks like in its final attachment on the wheel, with the chopper slotted into the gap in the switch, ready to interrupt the light path and create a signal synched to the wheel rotation.
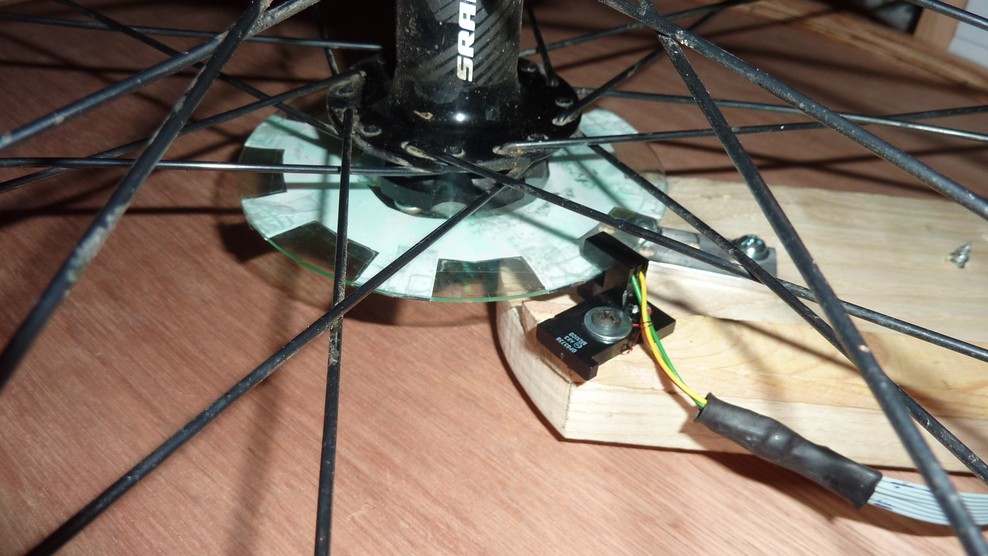 Ready to do its thing
I chose the 8-pattern originally thinking that I’d have 8 measurements per revolution by timing consecutive edges in the chopper timing pattern. This should theoretically give a great estimate of instantaneous speed. I soon realized that unless I cut it perfectly (I didn’t) there are bias errors all over the place. Instead, what’s very accurate is to time one edge vs. the same edge but now one revolution earlier. Its still possible to get 8 measurements per revolution, but there’s a bit more inaccuracy in this method. Nevertheless, its fine for what we need here.
With a little bit of signal conditioning, you now have a nice little signal that, with a bit of computation, gives the rotational speed and acceleration of the wheel, exactly what our model is looking for.
Soooo … about that signal conditioning.
Circuit diagram & component choices
Here’s the circuit diagram for the build.
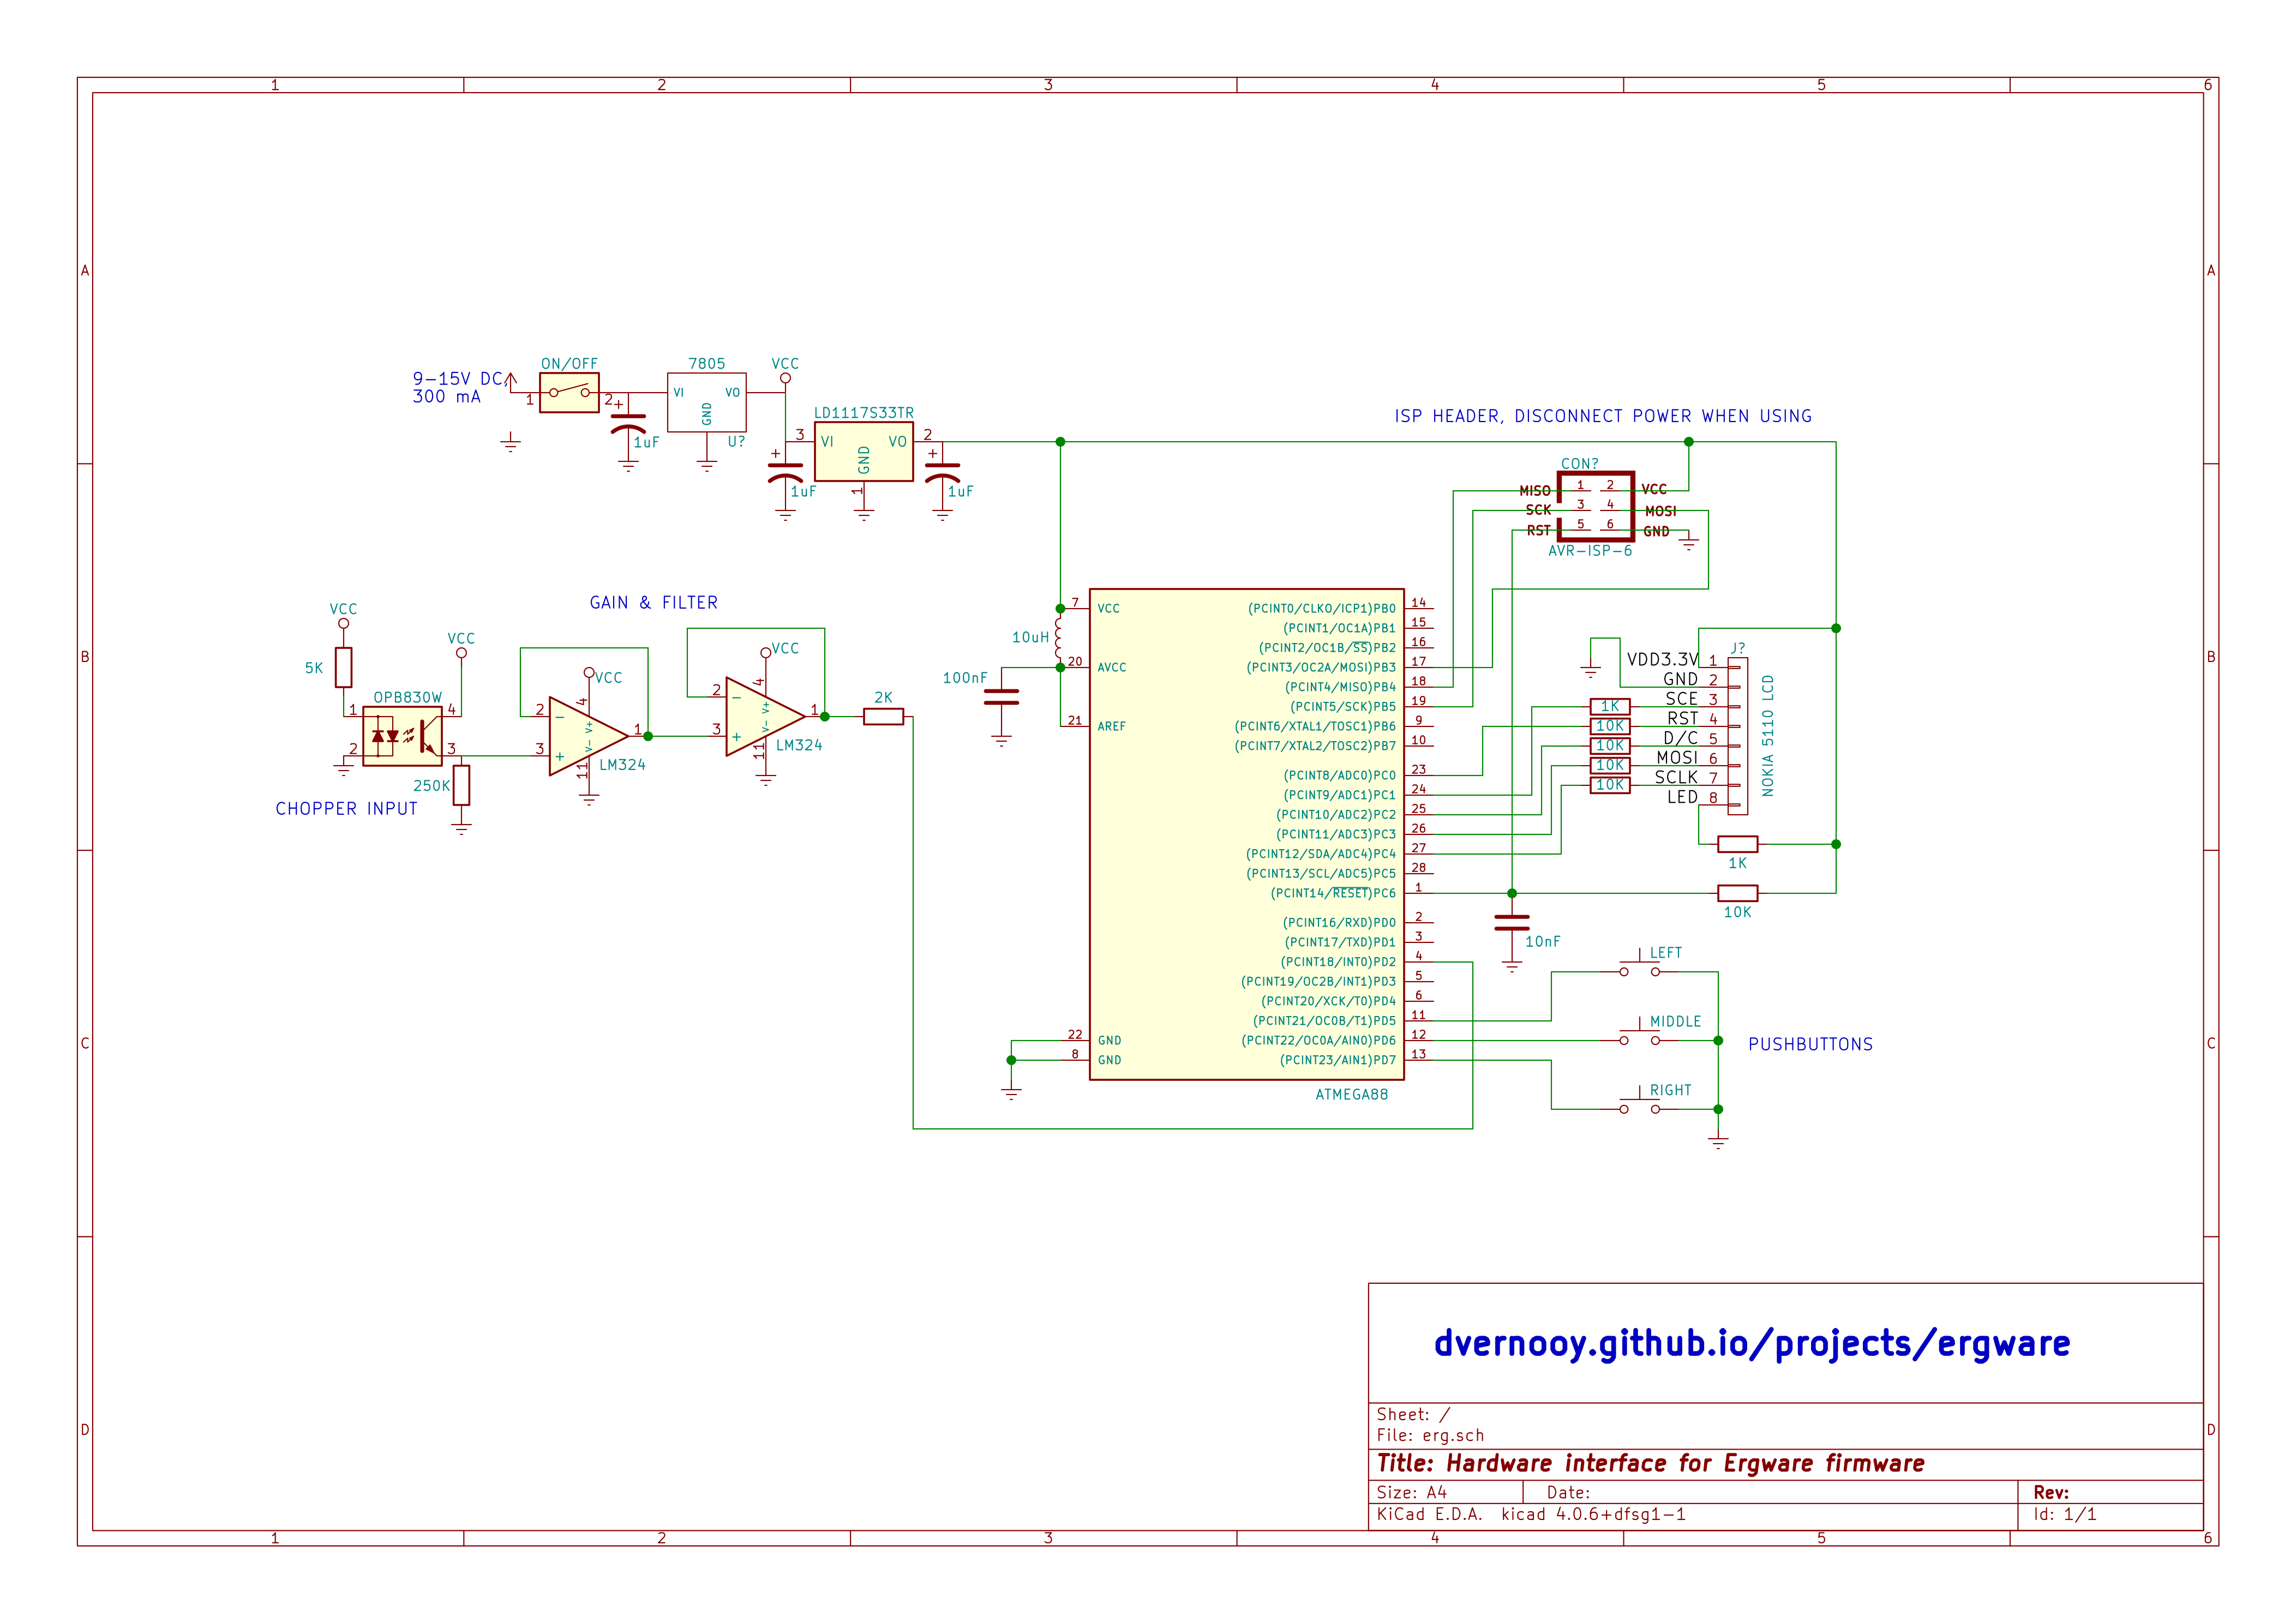 Circuit diagram for the Ergware firmware
The phototransistor-based optocoupler does all the action. I chose the resistor and then buffered it a couple of times before sending it directly into one of the digital inputs of the microcontroller (which makes the software detection and triggering via an interrupt really easy.)
I also used different supply voltages for the analog and digital parts, mainly because the LCD wants to work off of 3.3V and the optocoupler is spec’d for 5V.
I went with the ATMega328 microcontroller and a Nokia5110 LCD, because I had a bunch of code for both of these already written. The other thing I discovered is that the backlight to the LCD is a useful thing to have in this application.
The final piece is the power supply. I went with a super cheapo I had lying around and had a bunch of noise issues I traced to it (I had not had any problems with my benchtop supply). Simply swapping to a slightly better one did the trick.
Here is a close-up of my handiwork.
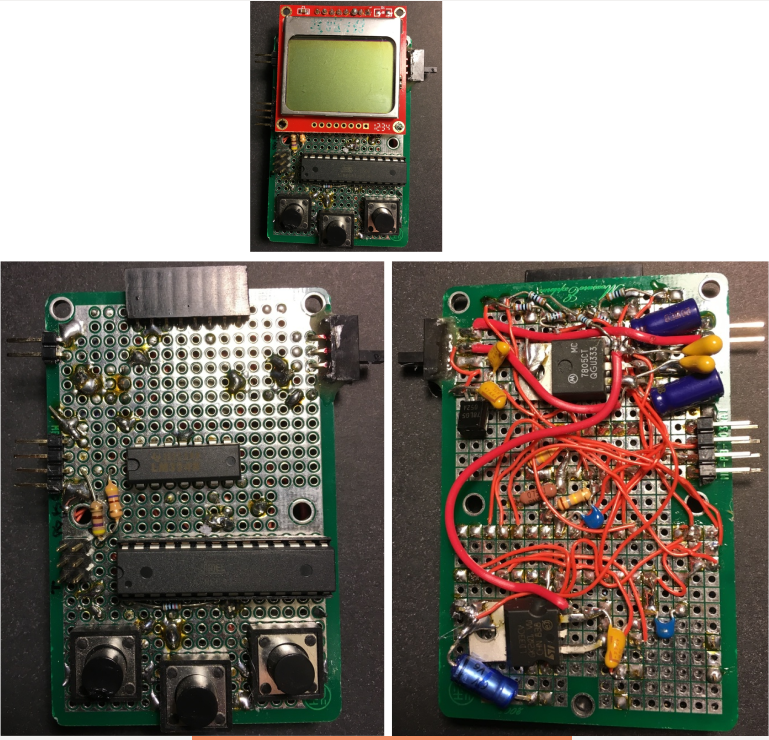 Perfectly reproducible (should be the theme of this blog)
Mounting to the erg
I used 1/8” pvc tubing as struts to hold the display in a convenient spot, make it possible for the rower to tweak the orientation, and also as a way to route the sensor signal and power supply cord. I made a little box for the circuit using foam board cut and glued to custom fit.
ErgWare v0.1
Display
In the first version, I couldn’t really ask for any advice from my “users” since the whole thing was supposed to be a surprise. So I just made a best guess as to what the screen should look like.
 Cramming info onto the screen in v1.0 … will they like it?
Structure
To get this stuff to the screen, we are timing the wheel rotation, calculating the various derivatives and then numerically integrating the model I described above.
The whole software is wrapped in one big loop, constantly keeping track of where in the stroke cycle we are .. using interrupts & timers to do most of the work & then periodically refreshing the display or checking whether the buttons have been pressed.
Interrupts and timers are important - I interrupted the processor every time the chopper wheel triggered. Despite my 8-slice pattern, I ended up using only a once-per-rev signal from the chopper as you can see from the (chop_ticks % 8 ) in the interrupt snippet below.
ISR(INT0_vect)
{
  cli();
  chop_ticks++;

  if ((chop_ticks % 8 ) == 0) {
	chop_ticks = 0;
	chop_counter[1] = chop_counter[0];
	chop_counter[0] = TCNT1;
	TCNT1 = 0;
	distance_rowed += cal_factor;
	if (locked ==1) locked = 0; //used for stroke count
  }
  sei();
}
I used the built in 16-bit timer 1 (TCNT1) to get accurate flywheel rotational timing.
I also needed a second timer for the rowing stroke timing. The stroke rate is something the rowers care about besides their speed and power output. Typical stroke rates might be 25 - 35 strokes per minute.
I then applied the screening criteria I talked about earlier to determine what part of the stroke cycle I was in & based on that, did the appropriate calculations to get average power over the cycle, get an estimate of rowing distance, increment stroke cycle counters and look at the various timers.
In most cases, I opted to do a straight average of 4 measurements to reduce any noise. More sophisticated filters are obviously possible.
The buttons have limited functionality in this first revision of the code. They can basically just reset the timers and/or the display of distance traveled. I had big plans for them, though.
Some interesting data
I wrote a piece of code during the development phase to write out to the EEPROM the rotational speed vs. time. Here is how it compares to the model.
 How the model stacks up against actual data: pretty darn close
Turns out pretty well! When I saw this, I charged forward full throttle with some confidence in the approach.
Good rowers vs. crappy rowers
So my daughter had been rowing for about 9 months when I had her take this thing for a spin. I recorded her power output vs. #of strokes at startup in the EEPROM. Then I did the same for myself, who had been rowing for all of 9 m-m-m-minutes. Guess who’s the NOOB?
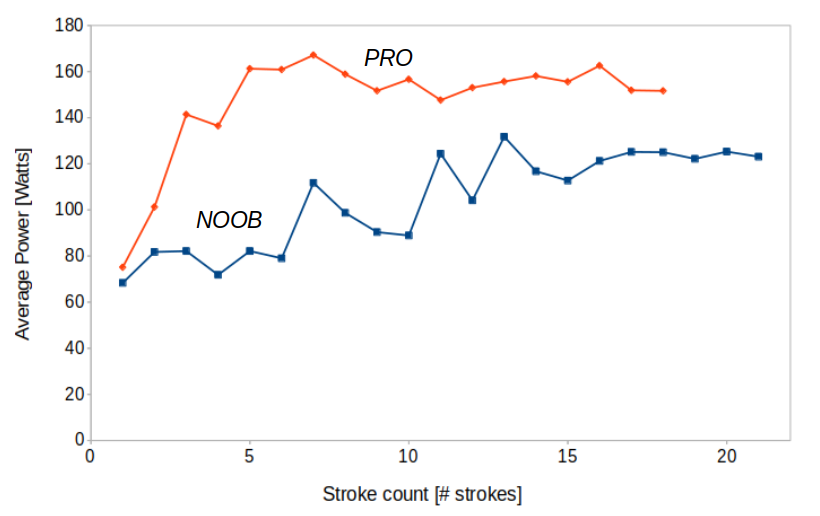 Am I actually any good at rowing?
ErgWare v0.2
v0.1 was in place for about 6 months, & then I made the mistake of asking “what else?”
User feedback
Wanna see more stuff. A countdown timer, calories burned, parameter setup. Bigger fonts. More, more, more. Ok, I listen to my users.
Enter the RTOS
Having learned my lesson on another project, it was time for a different approach to accommodate multiple screens that would be responsive to a user (an exhausted rower who probably has little patience for crappy embedded software).
I needed a menu, and I needed a scheduler. In short, I needed a lightweight RTOS for an 8 bit microcontroller. Virtually impossible to do what I wanted to without one. To see why, Here is a gallery of the screens I implemented in V2.0 -
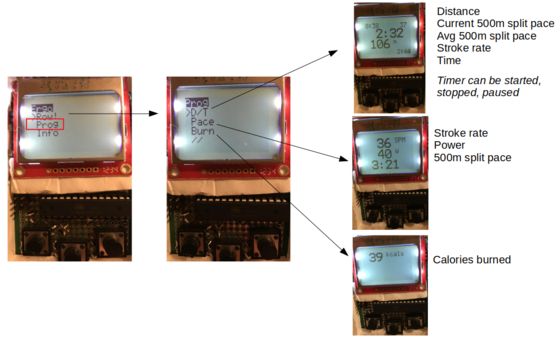
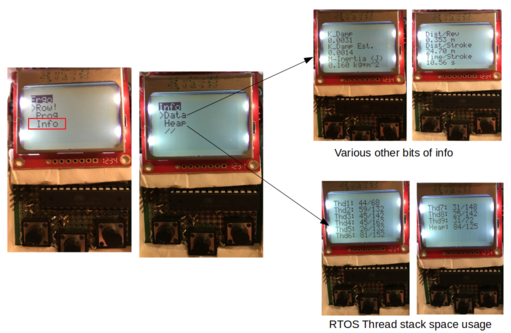 Screenshots of Ergware v0.2. More things to take your mind off of the lactic acid while rowing
Writing the code for these goodies was very straightforward since I had almost all of the information readily available. Other than the RTOS diagnostics (more below) the only really new thing was the calorie counter.
Which one?
Choices, choices … there are lots - even for my 8-bit AVR ATMega328. FreeRTOS, NuTTX, AtomThreads, ChiBIOS, RiOS, roll-your-own. After a bunch of investigation, I settled on NilRTOS, which is a lightweight variant of ChiBIOS that is still very flexible and pretty easy to incorporate. And I gotta say, I’m very impressed with [Gianni] & his team’s work - there is a bunch of documentation around to help.
Menu structure
I have a very simple menu structure that allows for nested sub-menus. All of the memory is pre-allocated, and could probably be done even more efficiently, but I’m pretty happy with it.
Pushbutton responsivity
One of the bigger questions I had was whether the buttons would be capable of interrupting the system with many threads running in order to give the user a responsive interface.
RTOS structure
I was able to do the whole thing with 8 threads, including a thread for monitoring the RTOS overhead itself.
/*********************************************************************************
Thread Table -   Remember to change threadcount in nilconf.h
Notes:
1. Use the stack tracer to optimize stack sizes
2. Priorities - look at order in Thread table
********************************************************************************/

THD_WORKING_AREA(waThread1, 16);
THD_WORKING_AREA(waThread2, 90);
THD_WORKING_AREA(waThread3, 90);
THD_WORKING_AREA(waThread4, 100);
THD_WORKING_AREA(waThread5, 96);
THD_WORKING_AREA(waThread6, 110);
THD_WORKING_AREA(waThread7, 80);
THD_WORKING_AREA(waThread8, 80);
//THD_WORKING_AREA(waTimer, 20); /*just for completeness, commented out here because defined in time.c

THD_TABLE_BEGIN
  THD_TABLE_ENTRY(waThread1, NULL, Thread1, NULL) //Button Press Handler
  THD_TABLE_ENTRY(waThread7, NULL, Thread7, NULL) //Chopper Calculations
  THD_TABLE_ENTRY(waThread2, NULL, Thread2, NULL) //Menu Navigation Handler
  THD_TABLE_ENTRY(waThread6, NULL, Thread6, NULL) //Stack Output via LCD
  THD_TABLE_ENTRY(waThread8, NULL, Thread8, NULL) //Stack Output via USART
  THD_TABLE_ENTRY(waThread4, NULL, Thread4, NULL) //Time, Dist & Calories
  THD_TABLE_ENTRY(waThread5, NULL, Thread5, NULL) //LCD navigation
  THD_TABLE_ENTRY(waThread3, NULL, Thread3, NULL) //LCD ergo
  THD_TABLE_ENTRY(waTimer, NULL, timer, NULL) //declared in time.c, run at lowest priority
THD_TABLE_END
Some things I learned implementing an RTOS in v0.2
Code for low overhead
I knew I’d be up against limits of the chip: 32K Flash, 2K SRAM, 1K EEPROM. I dealt with it by using all the usual tricks for minimizing SRAM usage. I also put in a stack tracer/monitor to look at all the thread memory usages & then used an “oversize by 20%” rule. I want to go back at some point and challenge myself to reduce Flash usage by another 30 or 40%, but that’s for another day.
Use the message passing & signaling structures of the RTOS
That’s what they’re there for. Once I learned about the binary semaphore implementation in NilRTOS, it was a nice way to restrict access to the LCD, which is an important resource.
/* Declare a semaphore */
semaphore_t lcdUSE; /*semaphore to protect the LCD*/
So whenever there was a taker for this resource, they would sit and wait for the semaphore to be available. For example, here is the code for a thread which needs the LCD to write out data to the screen
/*********************************************************************************
Thread 3 - LCD write out all the erg data
********************************************************************************/
THD_FUNCTION (Thread3, arg) {
	(void)arg;
	tp[0] = chThdGetSelfX(); //returns a pointer to current thread

  while (true) {
		// it starts in off state, or gets here when turned off. Eventmask1 turns it on
		chEvtWaitAnyTimeout((eventmask_t)1, TIME_INFINITE);
		// take control of LCD semaphore
		chSemWait(&lcdUSE);
		// switch lcd_context to thread 4
    ....
   }
}
Write lightweight usage services
Essential to ensuring optimal memory allocation. There’s a screenshot above of the usage statistics for each of the threads after a workout.
Learning by re-doing
Time to go back and re-read “The Boys in the Boat”.