
Heart Rate Monitor
Still working after all these years
 MacGyver, eat your heart out
Project overview
Welcome to my heart rate monitor project. These things have been around for a long time & you can buy them now for about $15 bundled with all kinds of software. So if you want to start measuring your heart rate, stop reading this, go buy one and have fun! Otherwise, stay tuned for all of the trials and tribulations of DIY’ing a heart rate monitor.
It started as a shotgun marriage between a dead Nokia 2115i cellphone and a chest strap for an old Polar T6 heart rate monitor - both of which were lying around. What better way to kill a couple of Saturdays then try to build my own receiver using the LCD out of the cell phone? Little did I know the long & winding road. If you’re still with me, you’ll know that navigating that road is where the real fun is!!!
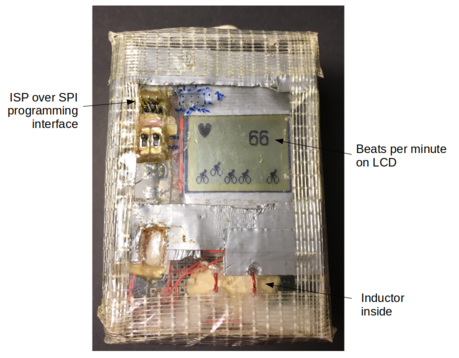
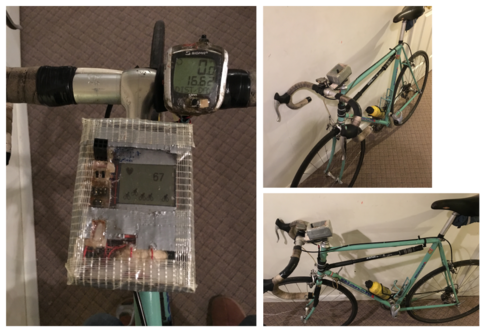
The end result was not super pretty looking, but it was such a fun project I thought I’d take you through it in detail. If you’re already laughing at me for doing this (i.e., hey, dude, Polar has been making these things since the early ’80s, where have you been & by the way, ever heard of Fitbit?), you’ll laugh harder when you see the pictures of the receiver attached to my bike with some modified pvc tubing:
 Nothing unusual to see here, move along
Here are a couple of charts of my heart rate vs. time for a 1.5 hour bike ride near my house, along with a screenshot of the elevation changes - pretty good correlation between the two. I used to be a decent hill climber.
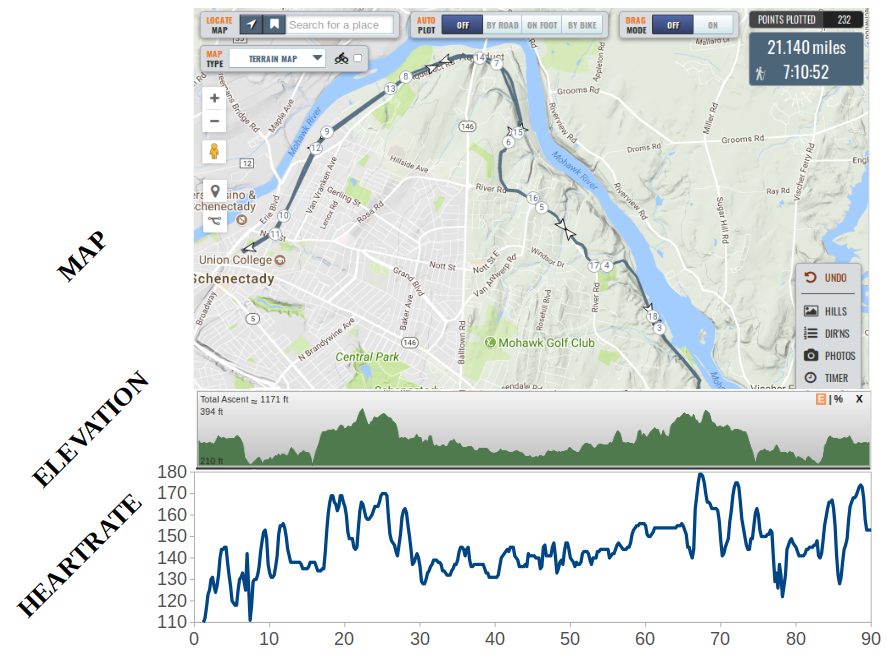 Pretty good match between hills & workout. Duh, whaddya expect?
And here is the average of a few rides on one of my usual 1.5 hr routes. I did a bit of stitching to account for a flat tire pit stop on one of the rides. Not sure its particularly interesting for any given year, but it will be interesting to look at how it changes over 5 or 10 yrs.
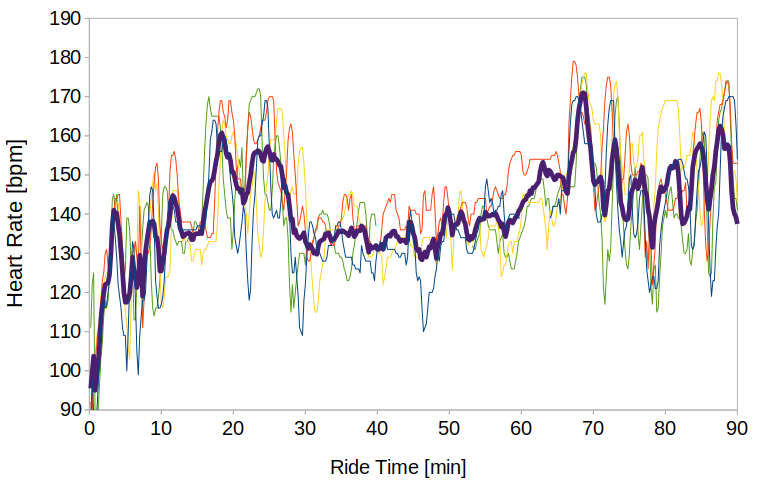 Pretty consistent ride-to-ride
So here we go. Time for some fun.
S.T.E.M.
Here’s how I built up my understanding, piece by piece.
Polar T6, talk to me
I had no idea what the old Polar T6 transmitter did or how it worked, so I opened it up - I don’t have an actual picture of the inside handy, but this “x-ray” picture (the second image of the two below) that I found on the web is pretty similar to what I saw inside. The key feature here is that inductor/coil on the bottom, and more specifically the magnetic field pattern that it creates (dashed lines):
![]() Heart rate monitor transmitter
Heart rate monitor transmitter
I was armed with background knowledge that many of these older transmitters work at 5.3 kHz. So, I did a couple of experiments after I had changed out the battery and made some modifications to the chest strap, which was in rough shape.
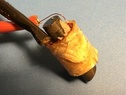
 Oh yeah, and this new chest strap looks so awesome
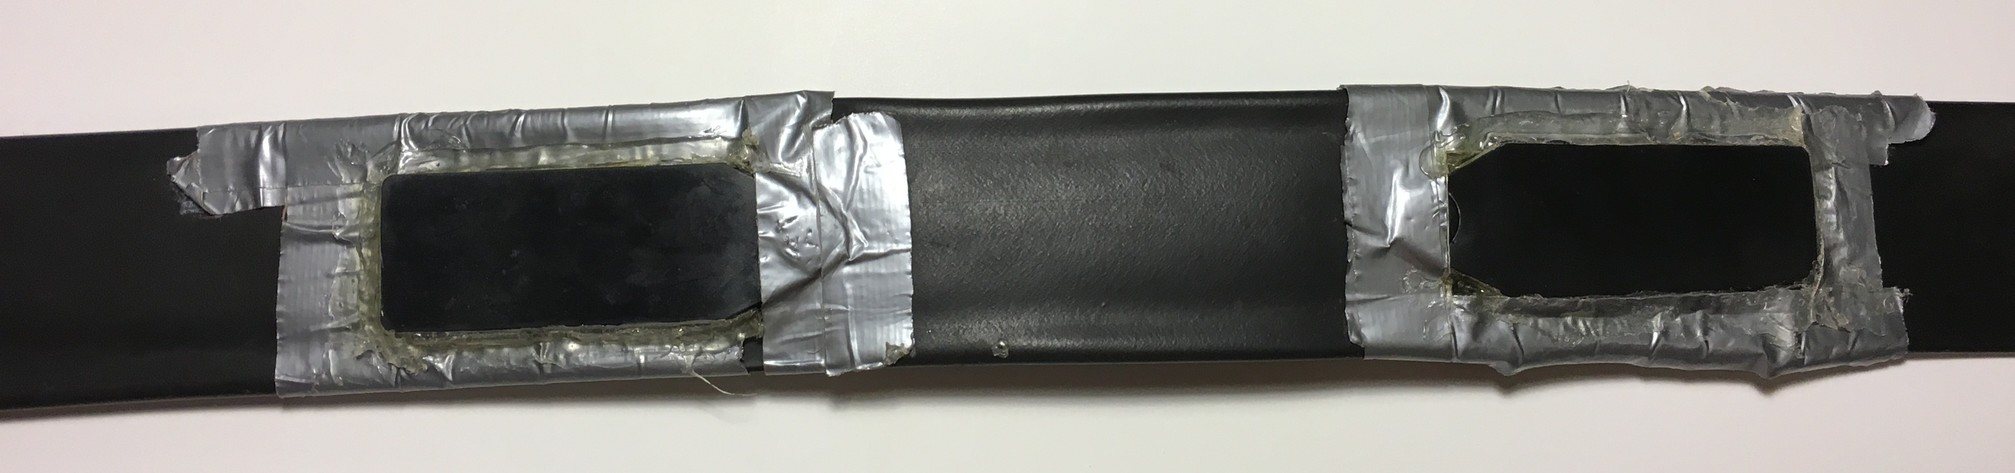
The first step was to directly wire this other old coil I had lying around into my oscilloscope:
 The coil I used to understand the transmitter
I held this second coil over top of the transmitter piece as it was attached to my chest. Here is what I saw on the scope:
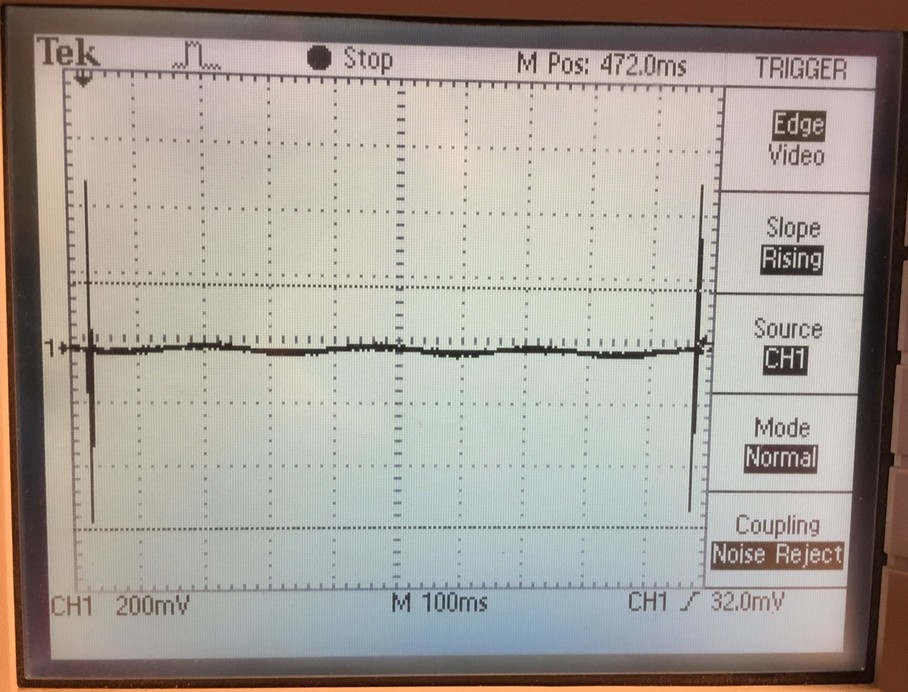 My heart be still! I’m alive!
Heartbeats! … spaced about 1 second apart. Here’s what the waveform looked like on successively zooming in from 100 ms to 5 ms to 1 ms to 100 \(\mu\)s (you can see the time scales on the scope images):
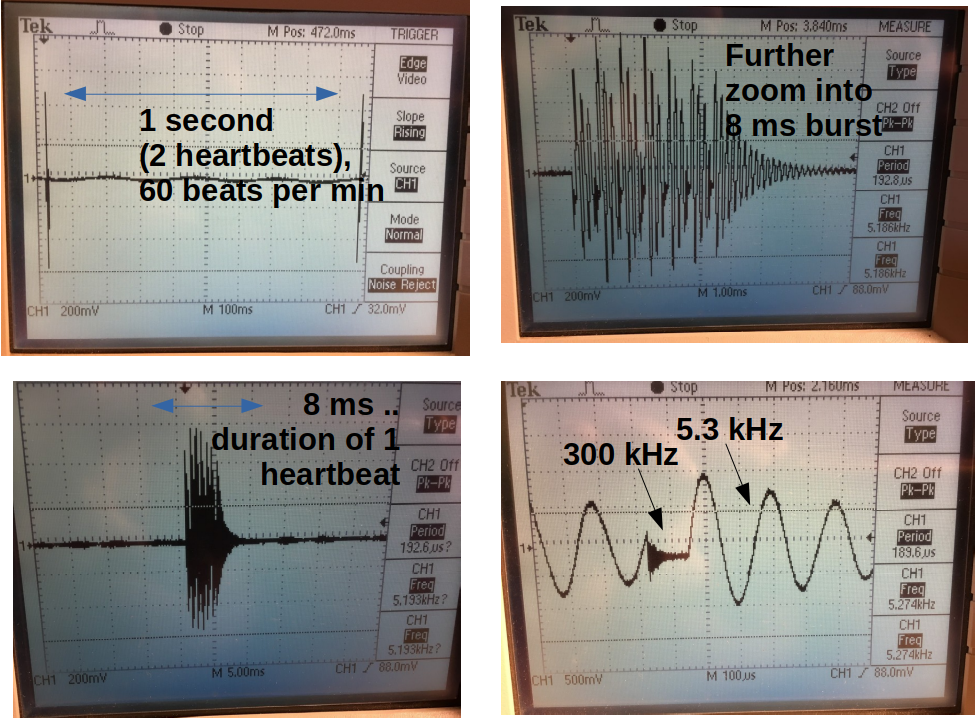 Successive zoom-ins on the oscilloscope while using the coil to see what the transmitter was doing
Interesting, it has some significant structure to it. Overall time of the heartbeat signal is about 8 ms, with the main bursts at 5.3 kHz interrupted by much shorter bursts at about 300 kHz. It might be coded or something. Wanting to move forward, I decided just to build a 5.3 kHz receiver & not worry about understanding the coding, because if I could reliably detect those 5.3 kHz bursts, I’d have my heart rate. So how do you detect a 5.3 kHz electrical signal?
Resonant magnetic coupling
A couple of things I noticed in my experiments:
As I moved the inductor even a few inches away, the signal faded … a sign of non-resonant coupling.
As I rotated the inductor 90 degrees, it was pretty easy to kill the signal altogether … a clue that the (electro)magnetic field orientation was important.
Well, the current the transmitter drives through its inductor creates a time-varying magnetic field. If I could interrupt those magnetic field lines with another inductor (just like I did in my experiment), I can detect that burst.
But, just one more thing - I want it to work a few meters away. The only way to do that was to “tune” the receiver circuit to the exact transmitter frequency of 5.3 kHz, while keeping the inductor \(L\) as large as practically possible. The way to do this is with an \(LC\) tank circuit, whose resonant frequency is
\[\begin{align*} & f = \frac{1}{2 \pi \sqrt{LC}} \end{align*}\]Inductors
The formula for inductance of a wound coil is:
\[\begin{align*} & L = \frac{\mu N^2 A}{l} \end{align*}\]where \(N\) is the number of turns, \(A\) is the area, \(l\) is the length and \(\mu\) is the relative permeability. So the number of turns are a big deal. Enough already. Time to build some hardware.
Hardware
Main inductor sensor
I had a ferrite core about an inch long, with a permeability multiplier of about 16, which meant for 1000 turns of coil I should expect 24 mH. The one I built measured 19 mH, which required a 47 nF capacitor to resonate at 5.3 kHz. I used the frequency sweep on my benchtop function generator to do fine tuning to 5.3 kHz using trial and error on the capacitance. Putting the two in parallel, I could now sense the signal from more than a meter away, which was a very good start! Time to build the rest of the receiver.
Analog receiver & overall circuit diagram
Here is the circuit I built-
 Circuit diagram for heart rate monitor
I have a note scribbled that Rick Moll(?) had a receiver very similar to this posted, but I can’t find that link anymore. If I do, I’ll put it here.
The main idea is to amplify & filter the ac signal with two op-amp stages, followed by peak detection and a level-shifting buffer prior to the microcontroller ADC input. I used a quad LM324, taking one of them to create a virtual ground of 2.4V (assuming Vcc of 4.8V from 3 AA’s) to shift up the AC signal .. which is required with a single-supply design like this. You also need to AC couple between stages to avoid amplifying the DC.
I know there are many things I could improve, but this project was not about style, which is actually my style. I didn’t spend any time laying out a board, but did it all “dead bug” on a piece of copper clad board. Not pretty, but fast to build and it works well.
If I get time, I’ll add a few images of the analog part of the circuit and receiver waveform output, but now I had something a digital circuit could deal with.
Nokia 2115i LCD
After a huge amount of googling, I found out that the Nokia 2115i’s mono LCD had the same pinout as those in the 1100/1200/1600. It had a special Hirose DF23-10 connector that I needed an adapter for
 Pinout for the LCD. Essential to avoiding smoke
and, most importantly, I found out it used the Philips PCF8814 96x65 pixel LCD driver. The spec sheet for this driver was indispensable - I was able to use it to bit-bang the SPI interface. The spec is posted with the code.
 pages 26-29 of PCF8814 spec were dog-eared by the end of this project
Supporting character set
I used a spreadsheet to build my own character bitmap set for the LCD, along with a few custom “graphics” … a bike and a heart that you can see on the LCD. I’ve also included this spreadsheet with the code.
![]() From raw material to finished product: WYSIWYG
From raw material to finished product: WYSIWYG
Microcontroller
And the rest of the circuit is based on the Atmel ATmega88 microcontroller. I used the built-in an 8MHz clock and a couple of AA batteries (3.2V) to power the digital part separately from the analog. I also included the ability for remote programming via an SPI header. All of the details are in the circuit diagram above.
There are a bunch of things I learned building this:
Filter the reset pin with 10K and 10nF when enabling ISP programming
There are many ways to reference the ADC voltage … pick one and go with it
Make sure the fuse settings enable the EEPROM to be saved during reboots & write the software so you can read it out
Packaging
Look away. Now. If you are still looking, here is a picture:
 Ummm. Yeah. Alrighty then.
This kind of style is usually actually ok for analog/low noise stuff as long as wires and leads are kept very short. Not so great for debugging & finding issues. The other thing I did is just made a “snap connect” so it easily attaches to the stem of my bike … just a piece of modified pvc with inlaid rubber for grip:
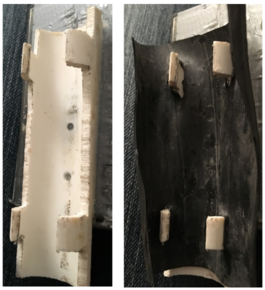 Snap-on connector
Software
Code
All the code is posted here. It is actually just one C file. You can call it ugly (it is), you can call it unreadable (it is) & I know there are a bunch of typos in the comments which I’ll try to fix up at some point. But it works, & very robustly. If you actually do read it, all the action is in a single main() loop. Here is my thought process …
Detecting a beat
My starting point now was the analog signal (masquerading basically as a digital signal at this point due to the speed and gain of my receiver) that rose and saturated very quickly when a 5.3 kHz burst was detected. The saturated voltage is about 4.7V at the upper rail of the last stage op-amp (I used a 5V regulated supply for the analog portion). I fed this waveform into the analog-to-digital converter of the Atmega88 and compared it to a software threshold that I set to determine whether it was a real heart beat signal.
To measure the timing between heartbeats, I had a choice of whether to do an interrupt driven timing scheme, or a polling-based scheme. I opted for polling simply because I was really early in understanding how all of this was going to work and I found it to be the most flexible way of dealing with the tricky bits (below) that arose. In hindsight, it would be fun to convert to an interrupt-driven approach.
Every time through the master polling loop (more details and a diagram just below), I took an analog-to-digital converter (ADC) measurement and compared it to a threshold value. If it was above the threshold, I had a hit.
In order to turn this into a time measurement, and eventually a beats-per-minute (bpm) rate, I used the polling loop counter \(H\). I calibrated the loop time off-line by feeding my software a fake heartbeat signal from a function generator that simulated a range of heartbeats from 30 bpm to 200 bpm with a square wave of variable duty cycle. I used this to do timing measurements to figure out the calibration constant corresponding to one pass through the loop. The polling loop was 1.61 ms long, so it would be 1245 polling loops between heartbeats for a heart rate of 30bpm and ~ 185 polling loops between heartbeats for 200 bpm. If you read the code, that is where the factor 37312 comes from … it would be 37312 loops through the code every second.
So how did I get such a long polling loop time? And, more importantly, since the loop time acts basically as a master timer, how to make it repeatable from loop to loop? More on this later.
For now, here is a little video of everything put together, demonstrating the stand-off detectability of the receiver, and the importance of keeping the transmitter and receiver coils roughly aligned. You can see that as I rotate my body with the chest strap relative to the receiver, the signal loses lock.
Tricky bits
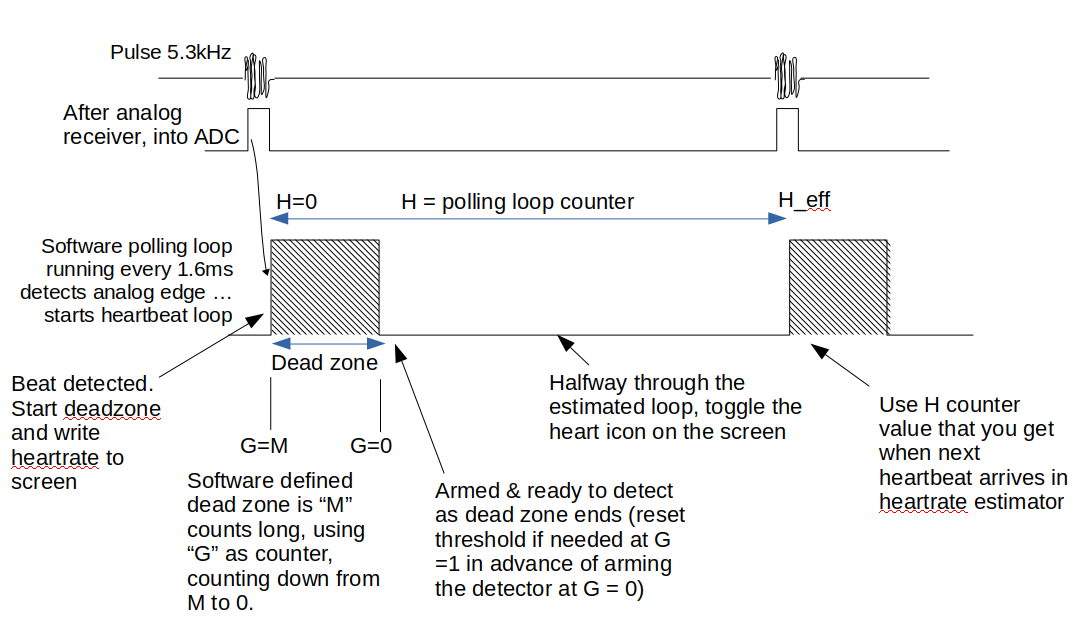
There were actually a number of practical issues to deal with to make this thing robust. I’ll explain how I dealt with them one by one, but it is probably best to start with a timing diagram/sketch.
 Details about how the code is structured to be robust
Make sure I didn’t get “double counts” from the heartbeat waveform, which as we already saw is very “bursty”
I used a dead zone of \(M\) polling loop counts long right after the first detection instant. A choice of \(M\) around 40 was a good compromise because 40*1.6 = 64 ms is much longer than the 8 ms heartrate burst (so it would’t trigger multiple times on clutter) but much shorter than the ~ 300 ms between beats at 200 bpm. This meant the software would ignore any subsequent ADC hits for the next \(M\) polling loops. I used a counter \(G\) to countdown from \(M\) to zero. Ultimately, made the length of the dead zone dynamic (i.e., heart rate dependent) since I wanted to ensure no false triggers at low heart rate.
Make sure an appropriate threshold was set to know that I had a real heartbeat
I kept track of highest ADC value we got the last time through the loop (remember, it is measured every polling loop) and right before the dead zone ends (\(G = 1\)) and we’re ready to start detecting again, I reset the threshold to half of that value. Basically makes the assumption that heartbeat to heartbeat the environment isn’t changing much.
Handle a “loss of lock” on the heart rate & recover it
Ok, so I’m riding on my regular route on a bike path and I notice a drop-out at one particular place. Here is a google map view .. do you see the issue?
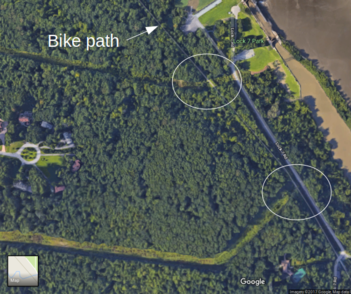 Not a friend, an enEMI
Yeah, overhead or underground power lines, especially those running somewhat parallel to my route, carry a current that generates a magnetic field that induces more currents in my receiver that swamp the receiver. Even though its not resonant, it causes large enough noise to wreak havoc. So how to recover the heartbeat in a case like this, especially in an extreme case where my heartbeat changes alot during this interval?
I set an absolute lower limit on the detector threshold so as not to trigger on noise, but if the heartbeat loop counter \(H\) exceeded a maximum determined by the previous heartbeat interval, I start to allow the detection threshold to drop, & I continue aggressively dropping the detection threshold until it reaches a pre-determined lower limit. This allows the system to re-lock. I also use the same pre-determined lower limit to establish initial lock & the re-set the baseline after the first few beats.
Give myself a visual indication that all of this was working
I decided that a beating heart (what else!) and the heart rate number in a huge font were the way to go. So I designed that heart icon and had it display for half of the heart rate interval. However, every time through the software polling loop I wrote both the heart rate number and either the heart icon or a blank signal icon. This way, the same amount of delay was introduced for each loop. In fact, the time to write these things was by far the dominant delay in the loop and accounted for the 1.61 ms polling loop time. So taking care to make them the same loop-to-loop was important. Again, maybe a reason to go to an interrupt method in the future.
Capture the heart rate information so I could look at it after the exercise period
Funny enough, I did implement an interrupt-driven procedure for probably the least critical thing - saving the heart rate to the EEPROM. Yes, I’m often backwards. Anyways, the ATmega88 only has 500 bytes of EEPROM available. So, I sampled the heart rate every 3 seconds, averaged 4 of these samples, and then every 12 seconds (every 4th sample) wrote the average as one byte (0..255) to the EEPROM. This lets me exercise for 100 minutes and capture my heart rate that whole time. I just read the whole thing out at the end over the SPI interface and plot it in a spreadsheet.
A nit point, but because of the way I wired things up, I made sure the EEPROM is not initialized in the code until a first heartbeat is detected. That way, to read out the EEPROM after exercising I just read it out over the SPI/ISP interface with both switches open (using the ISP’s VCC line to power it up) and without any chest strap.
Make sure everything worked for the dynamic range of heart rates from 30 bpm to 200 bpm
I used my offline signal generator to test out the algorithm across this large range. That worked well, rather than me having to work up a sweat every time I tweaked something in the code.
Make sure that as my heart rate changed during exercise, the monitor could follow it robustly
This last question requires its own section …
… Heart rate following algorithm
One of the more interesting challenges was to figure out how to follow changes in heart rate in a robust way that had a good user experience. I noticed my heartbeat could jump by ~ 20 beats per minute in only a few seconds when exercising and I’d want my sensor to follow this reasonably well. So here’s what I did. I first decided that, independent of what my current heart rate was, I wanted the monitor to settle within 5% of the new heart rate in about 8 seconds. Somewhat arbitrary, but it seemed reasonable for any application I had in mind.
So, each new measurement gave me a new instantaneous heart rate interval (called \(J\) in the code). So I wanted to update the current heart rate \(K\) to follow the new heart rate \(J\). The error at any point in time is \(e = J-K\) and at every heartbeat we need to update \(K\) by adding to it a certain percentage \(f\) of this error. If you do it all at once (set \(K = J\)), the display bounces around & drives you crazy. If you add too little, its like you have an unresponsive monitor.
So how much to add? Well, I knew I wanted to close the gap to within 5% in 8 seconds. So the number of heartbeat intervals required is \(8K/60\). The factor 60 converts beats-per-min to beats-per-second. At each new measurement, we want to update \(K\) so
\[\begin{align*} K_1 = K_0+fe = K_0+f(J-K_0) \end{align*}\]and the gap to \(J\) after 1 heartbeat interval is
\[\begin{align*} J-K_1 = (1-f)(J-K_0) \end{align*}\]After 2 heartbeats the update is
\[\begin{align*} K_2 = K_1+f(J-K_1) = K_0 + 2f(J-K_0)-f^2(J-K) \end{align*}\]so the gap to \(J\) is
\[\begin{align*} J-K_2 =(1-f)^2(J-K_0) \end{align*}\]You can see where this is headed. After the 8 seconds, or the \(n = 8K/60\) heart beats, the gap is \((1-f)^n(J-K_0)\). But I wanted this to be 5%. So we get the equation that \((1-f)^{\frac{8K}{60}}=0.05\) and we can solve this for
\[\begin{align*} f = 1-e^{\frac{60\ln(0.05)}{8K}} \end{align*}\]which gives us the update factor \(f\) to use at every single step, given \(K\). Finally, we can put it all together: with every heartbeat we measure a new value for \(J\) and we know \(K\) from the previous step … so we can apply the update rule:
\[\begin{align*} K = K +f(J-K)= K + (1-e^{\frac{60\ln(0.05)}{8K}})(J-K) \tag{1} \label{master} \end{align*}\]Below is a screenshot of a numerical model of how this algorithm settles.
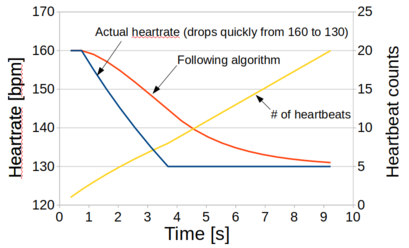 Following the telltale heart
Wheew .. long explanation for something that ends up only being a few lines of code:
//ADJUST HB with a partial step to current value
if ((J>0.5*K) && (J< 2*K)){
  coeff = 1 - exp(log(tolerance)/(seconds_to_lock*Keff/60)) ;
    if (coeff > attack_max) coeff = attack_max ;
}
else coeff = 0.05;
if (K > J) {
  K = K - coeff*(K-J);
}
if (K < J) {
  K = K + coeff*(J-K);
}
This algorithm in equation \(\eqref{master}\) guarantees a nice display that follows the heartbeat changes in a sensible way. There is one hill around our house where I can go from 130 bpm to 185 bpm in about 15 seconds - & my monitor follows it well. The only technical issue in implementation is that I had to use real precision math, but that could always be changed to integer math at some point.
Learning by re-doing
I am thinking about making major changes - learn by (re)doing & all that - to the packaging (no room for improvement there) & code (who needs a menu) at some point … or maybe I’ll buy a fitbit. It has 10X the functionality at 1/10th the hassle. All of the code & spreadsheets are posted. here. Enjoy.